.avif)
Outbuild is online scheduling software to work together on connected project schedules and look-aheads, enabling everyone to move faster.
Key Takeaways

- Schedules, Lookaheads, and Weekly Work Plans within one integrated platform.
- Real-time insights and project analytics through automated dashboards.
- Easier, streamlined plan management through a user-friendly interface.
Table of contents
- Understanding the Basics of Construction Dashboards
- How Construction Dashboards Improve Project Management
- Key Features to Look for in a Construction Dashboard
- Construction Dashboard Examples
- Improve Efficiency with Construction Dashboards
Managing construction projects often feels like juggling a dozen moving pieces at once. Between tracking progress, aligning teams, and ensuring efficient resource allocation, maintaining productivity and minimizing delays can quickly become overwhelming. That's where construction dashboards come in.
A smart construction dashboard is like a plane's cockpit—where important information comes together to guide the journey. Just as pilots use tools to stay on course, project managers rely on dashboards to track schedules, budgets, and progress. When turbulence hits, the dashboard keeps everything on track, turning chaos into control.

These powerful dashboards bring clarity and efficiency to even the most complex projects. They're more than just a nice-to-have—they're game-changers for Project Managers, Superintendents, and other construction teammates.
A construction dashboard is a digital hub. It provides a real-time view of your project’s key metrics, progress, and data. Think of it as the control center for your project, where all the important information is easy to see and manage.
Dashboards pull together data from different sources like schedules, budgets, and team updates. They are a big improvement over clunky spreadsheets and manual trackers. They make it easy to keep everyone informed from start to finish.
Using the right construction dashboard can make your work easier. It helps whether you are building one structure or managing many projects. This can speed up your project's success.
A construction company dashboard is like your project's secret weapon. Here’s how they enhance project management:
1. Improved Decision-Making with Real-Time Data
Dashboards provide up-to-the-minute insights from your construction site. Whether it's tracking materials usage or identifying delays, you'll always have accurate information at your fingertips for informed decisions.
2. Enhanced Collaboration and Communication
Construction dashboards centralize data, removing the issue of siloed information. Everyone from superintendents to project engineers can access the same information, promoting transparency and improving team collaboration.
3. Efficiency and Time Savings
Manual monitoring is time-consuming and prone to errors. Dashboards automate data collection and visualization, allowing you to focus on high-value tasks instead of administrative work.
4. Risk and Cost Management
Dashboards help you spot and tackle potential risks early on. If labor hours exceed the budget, your dashboard will alert you. This helps you manage costs before it becomes a bigger problem.
The benefits of construction dashboards come down to three main things. They keep an overall project on budget, on schedule, and of high quality.

Not all construction dashboards are designed equally. When selecting a dashboard for your team, look for these essential features:
- Data: Clear graphs and charts that transform raw data into actionable insights.
- Real-Time Analytics: Updates that give you the most current project information.
- Flexibility: The ability to tailor the dashboard to your project-specific needs.
- Integration Capabilities: Seamless synchronization with tools like Procore.
- Accessibility: Cloud-based systems enable on-the-go access for field crews and office managers alike. P.S: It's time to discard the construction dashboard Excel file that no one can access.
A powerful dashboard not only tracks metrics but also points out gaps and suggests solutions. This tool becomes a vital companion for staying agile in the field and for risk management.

There are several different types of construction project dashboard examples. These project dashboards have a major component in common: real-time data tracking.
- Construction Company Dashboard: Offers a high-level overview of a company’s entire project portfolio. It provides summary data across multiple projects, helping stakeholders monitor overall performance and resource allocation.
- Construction KPI Dashboard (also known as Construction Project Dashboard): These dashboards focus on individual projects. They monitor important Key Performance Indicators (KPIs). These include costs, schedules, safety incidents, quality defects, and labor efficiency. They also track other key metrics.
- Construction Progress Dashboard: It uses color codes to show project statuses. This gives quick insights into progress, delays, or completed tasks.
- Construction Safety Dashboard: Dedicated to safety metrics, these dashboards monitor injury rates, days lost due to accidents, reported incidents, corrective actions, and other safety-related data.
Each type of dashboard has a special purpose. However, they all aim to improve decision-making with clear, useful insights. Several different types of software exist that you can use for these dashboards to manage your projects.
Let's jump into two construction dashboard examples that Outbuild offers for construction project management.

The future of schedule management
Download the playbook to learn more:
- Integrates effortlessly with Procore.
- Designed with simplicity in mind.
- Leverage the power of lean construction.
The future of schedule management
Outbuild's Construction Company Dashboard
Say goodbye to the challenging days of managing a construction schedule in excel. And, no more trying to navigate a construction dashboard template that doesn't work. Say hello to Outbuild, software equipped with easy-to-use construction dashboards filled with data points.

With smart construction dashboard software like Outbuild, you can view all your project schedules in one place. This gives you a quick look at whether your projects are on track or delayed. You can then plan confidently for the future.
With Outbuild's Company dashboard, you can see an overview of your project portfolio. This includes Start and End dates, Durations, Real-Time Progress, and Baseline Variances.
It's simple to manage many projects in one place. You can see exactly when your resources will be ready for the next task in gantt chart form.

Outbuild's Construction KPI Dashboard
Outbuild's Analytics makes tracking KPIs effortless and effective. Users can identify bottlenecks early and optimize processes to minimize delays. Outbuild delivers clear visualizations and insights to ensure that data backs every decision.
Key Features of Outbuild's construction scheduling analytics software include:
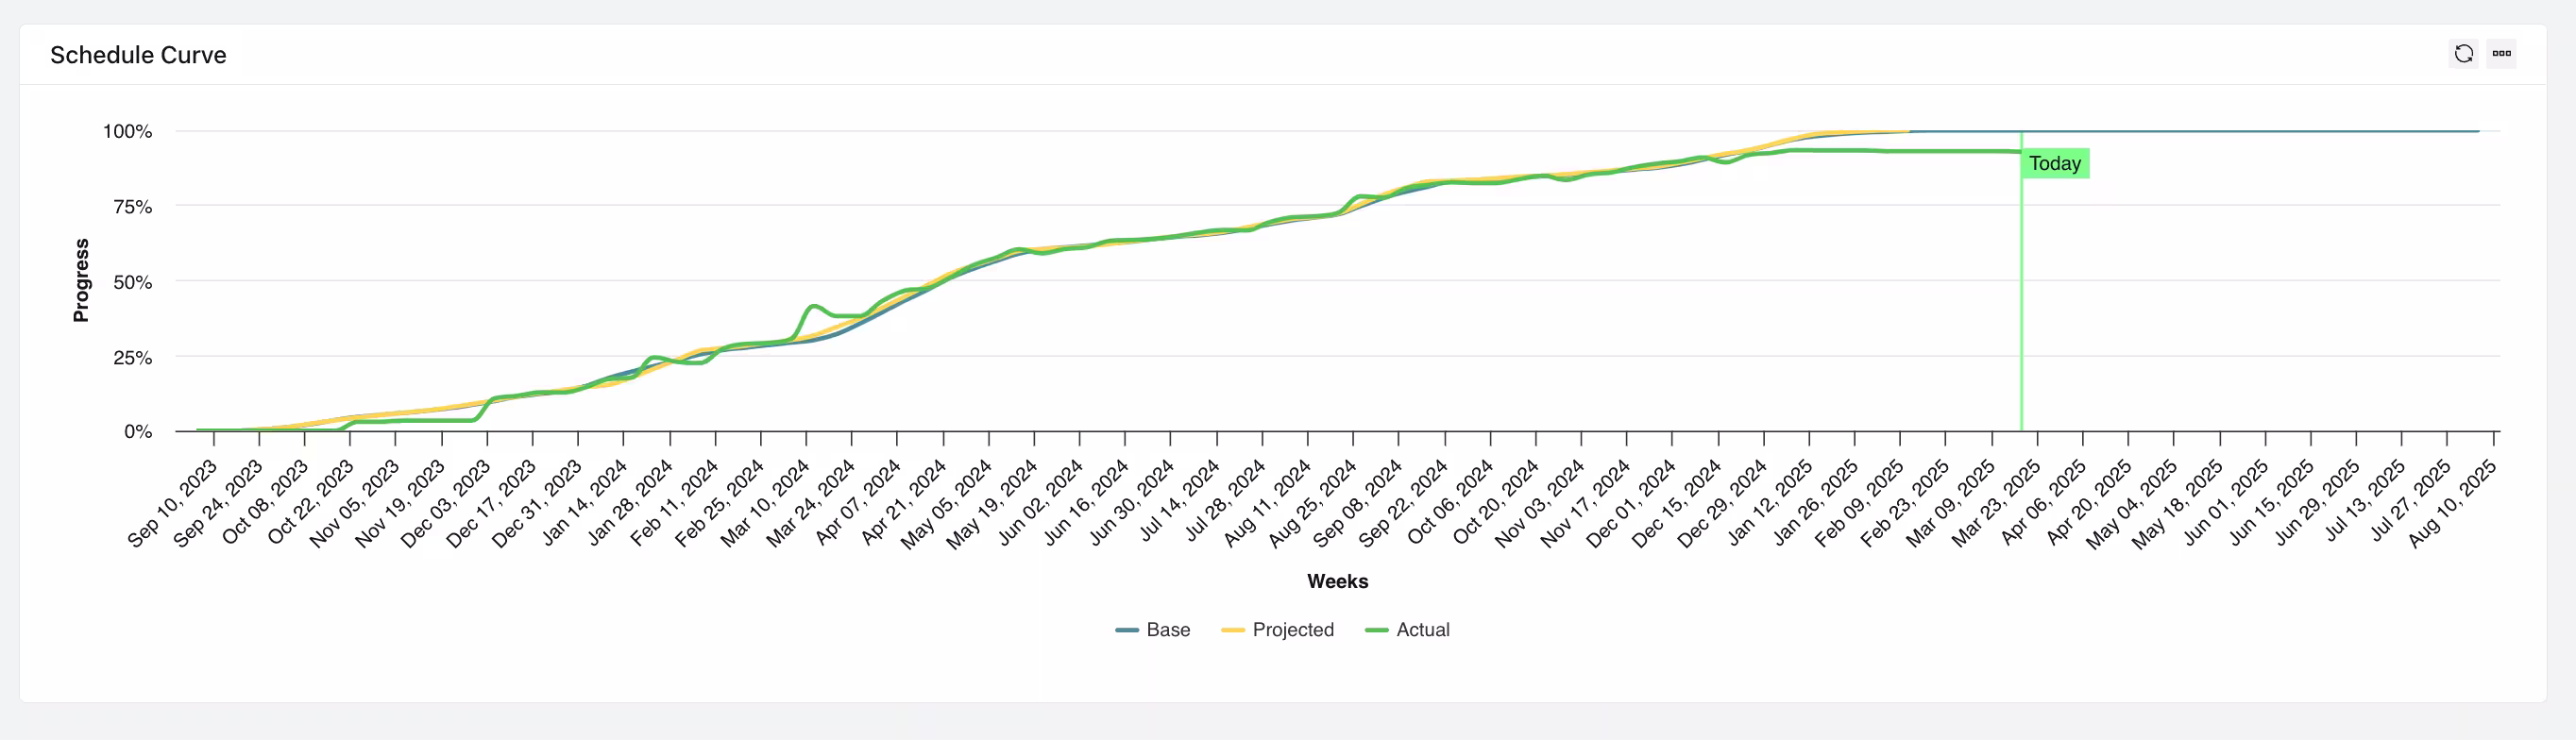
Project Performance Tracking through the S-Curve: To understand your project's long-term performance, compare your base plan with the projected finish and the actual progress.
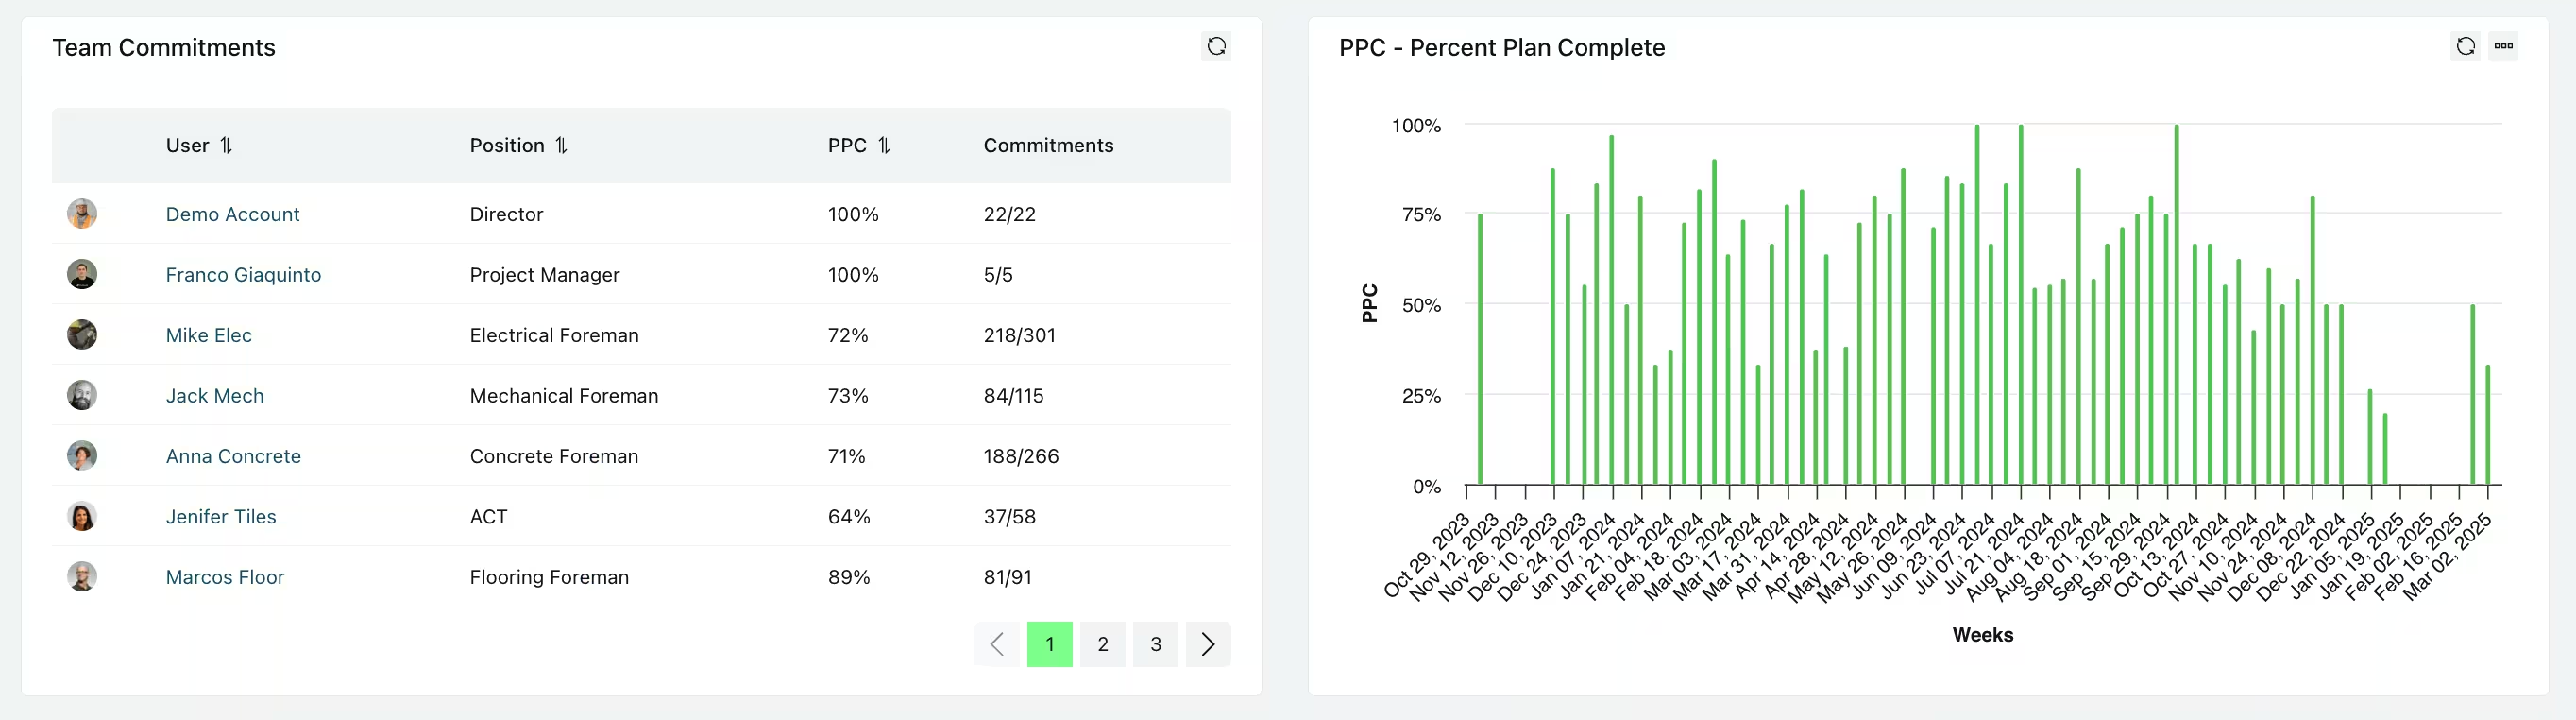
Team Commitments: Easily track project team members' Weekly Commitments and PPC (Percent Plan Complete) using Outbuild's automatically calculated Analytics.
Percent Plan Complete (PPC): Monitor how your team and trades are performing on a weekly basis. Use this to proactively address issues and avoid delays.
Team Roadblocks: Review a central spot of all the known issues on the job site through the holistic roadblock view.
Percent Roadblock Removed (PRR) Measure your team’s effectiveness in removing constraints or roadblocks, ensuring smoother project execution.

Weekly Commitments: Understand, at a glance, weekly commitments from various subcontractors.

Roadblocks Breakdown: Check out roadblocks by user with easy indication of if the roadblock has been removed, expired, is open or in draft form.
Commitments Breakdown: A detailed breakdown of weekly commitments, organized by user for clarity and focus.

Reasons for Variance: Visualize your team’s performance, pinpointing the main categories of variance. Analyze how factors like RFIs, inspections, or change orders are affecting your planning.
Upcoming Roadblocks: Easily identify upcoming concerns that will unfold in the near future and who's on the hook to solve them.

Speed Curve: Quickly understand how efficiently the team completes work compared to the planned schedule. By visualizing progress rates, project leaders can easily identify whether tasks are progressing, stagnating, or falling behind expectations.
Current Offset: With the Current Offset feature, team members can see how their project is doing compared to the original plan. This helps them spot and fix any problems or delays early. They can make changes to keep the project on track.

Construction KPIs and dashboard are important to manage your projects. Outbuild tracks these metrics to find out what stops your weekly work from finishing on time. It provides useful insights to keep your project on track.
Construction dashboards are much more than data tools—they're the foundation of modern project management software.
Using a construction project dashboard template that rarely updates is not helpful. This also leads to poor customer satisfaction.
You can use software for real-time updates.This helps improve teamwork. It also makes decision-making easier. With these features, you can complete your work within the project timeline and within budget.

"Outbuild is the future of scheduling and construction management programs. I love that it establishes camaraderie amongst trade partners and constraints being identified within the schedule. I love the analytics section."
Learn more about how Outbuild fit the bill for Catamount when it came to connecting their field personnel - Case Study.With Outbuild's dashboards, you can stay ahead of potential risks and keep your projects running smoothly. Start using construction dashboards today and see the difference it makes in your project management process.
Give one of our construction dashboard solutions a try and experience the power of real-time data for yourself. Keep your projects on track with Outbuild! Book a demo or sign up for a free trial today!
The future of schedule management
Download the playbook to learn more:
- Integrates effortlessly with Procore.
- Designed with simplicity in mind.
- Leverage the power of lean construction.
The future of schedule management
Outbuild's Construction Company Dashboard
Say goodbye to the challenging days of managing a construction schedule in excel. And, no more trying to navigate a construction dashboard template that doesn't work. Say hello to Outbuild, software equipped with easy-to-use construction dashboards filled with data points.
With smart construction dashboard software like Outbuild, you can view all your project schedules in one place. This gives you a quick look at whether your projects are on track or delayed. You can then plan confidently for the future.
With Outbuild's Company dashboard, you can see an overview of your project portfolio. This includes Start and End dates, Durations, Real-Time Progress, and Baseline Variances.
It's simple to manage many projects in one place. You can see exactly when your resources will be ready for the next task in gantt chart form.
Outbuild's Construction KPI Dashboard
Outbuild's Analytics makes tracking KPIs effortless and effective. Users can identify bottlenecks early and optimize processes to minimize delays. Outbuild delivers clear visualizations and insights to ensure that data backs every decision.
Key Features of Outbuild's construction scheduling analytics software include:
Project Performance Tracking through the S-Curve: To understand your project's long-term performance, compare your base plan with the projected finish and the actual progress.
Team Commitments: Easily track project team members' Weekly Commitments and PPC (Percent Plan Complete) using Outbuild's automatically calculated Analytics.
Percent Plan Complete (PPC): Monitor how your team and trades are performing on a weekly basis. Use this to proactively address issues and avoid delays.
Team Roadblocks: Review a central spot of all the known issues on the job site through the holistic roadblock view.
Percent Roadblock Removed (PRR) Measure your team’s effectiveness in removing constraints or roadblocks, ensuring smoother project execution.
Weekly Commitments: Understand, at a glance, weekly commitments from various subcontractors.
Roadblocks Breakdown: Check out roadblocks by user with easy indication of if the roadblock has been removed, expired, is open or in draft form.
Commitments Breakdown: A detailed breakdown of weekly commitments, organized by user for clarity and focus.
Reasons for Variance: Visualize your team’s performance, pinpointing the main categories of variance. Analyze how factors like RFIs, inspections, or change orders are affecting your planning.
Upcoming Roadblocks: Easily identify upcoming concerns that will unfold in the near future and who's on the hook to solve them.
Speed Curve: Quickly understand how efficiently the team completes work compared to the planned schedule. By visualizing progress rates, project leaders can easily identify whether tasks are progressing, stagnating, or falling behind expectations.
Current Offset: With the Current Offset feature, team members can see how their project is doing compared to the original plan. This helps them spot and fix any problems or delays early. They can make changes to keep the project on track.
Construction KPIs and dashboard are important to manage your projects. Outbuild tracks these metrics to find out what stops your weekly work from finishing on time. It provides useful insights to keep your project on track.
Construction dashboards are much more than data tools—they're the foundation of modern project management software.
Using a construction project dashboard template that rarely updates is not helpful. This also leads to poor customer satisfaction.
You can use software for real-time updates.This helps improve teamwork. It also makes decision-making easier. With these features, you can complete your work within the project timeline and within budget.
"Outbuild is the future of scheduling and construction management programs. I love that it establishes camaraderie amongst trade partners and constraints being identified within the schedule. I love the analytics section."
Learn more about how Outbuild fit the bill for Catamount when it came to connecting their field personnel - Case Study.With Outbuild's dashboards, you can stay ahead of potential risks and keep your projects running smoothly. Start using construction dashboards today and see the difference it makes in your project management process.
Give one of our construction dashboard solutions a try and experience the power of real-time data for yourself. Keep your projects on track with Outbuild! Book a demo or sign up for a free trial today!


Ready to see Outbuild?
Join hundreds of contractors from 10+ countries that are saving money by scheduling better